
Analytics: sections, filters and overview
The Analytics section brings audit results, plan completion and tasks together in one place. It has eight items in the left menu. After you sign in, the dashboard opens Home with the morning briefing — see Home: the AI Control morning briefing.
Analytics sections
- Dashboards — your own summary pages: cards with metrics, charts and lists that you arrange and configure yourself, including with AI. See Dashboards.
- Overview — key metrics for the period and what needs attention.
- Locations — location ranking, results heatmap, locations with no audits.
- Checklists & violations — which items are violated most often, plus a breakdown by checklist.
- Auditors — who audits how much and who scores more leniently or strictly than others.
- Plan completion — how many scheduled audits were done and where the plan is falling behind.
- Tasks: completion — open and overdue tasks, assignees.
- Routines: completion — whether routines are done on time, where and at what hours they fail, which steps are not done. See Routines analytics.
- Audit log — every audit individually, with reports and exports.
Learn more: Dashboards, Locations, checklists and auditors, Plan completion and tasks, Audit log.
Filters: period, locations, checklists, auditors
The filters sit above the content of every section except the Audit log, which has its own. Dashboards have the same filters, but each dashboard keeps its own default filters.
- Choose a period. 7 days, 30 days, 90 days, 12 mo. or Period for custom dates, then Apply. The default is 30 days.
- Narrow down locations, checklists and auditors. Tick the ones you need in the drop-down lists. If nothing is selected, all of them are included.
- Reset if needed. The Reset button appears when locations, checklists or auditors are selected and clears that selection; the period stays the same.
Filters are remembered as you move between sections. Below the page title you'll see the selected period and the previous period of the same length — all changes (“+3 pp”, “−12%”) are compared against it.
Chart granularity depends on the length of the period: up to 31 days — by day, up to 120 days — by week, longer — by month.
Analytics shows the locations where you have the “Analytics” permission: by default your own locations (where you work or manage, plus the location of today's shift); an administrator sees all company locations. In the filter this is shown as “My locations”. Who sees what — Roles and permissions.
What's counted
- Only completed audits, by audit date.
- An audit result is always a percentage from 0 to 100, including for points-based checklists. See How the audit result is calculated.
- A violation is a “No” answer to a question.
- Data is updated with a delay of up to 5 minutes.
The Overview page
Cards at the top:
- Audits — how many were done and how many auditors performed them.
- Average result — the average percentage and the share of audits scoring 70% or higher.
- Violations — the number of “No” answers, the average per audit and their share of all answers.
- Location coverage — how many locations were audited in the period out of the total.
- Plan completion — the share of scheduled audits from the Planner that were done.
- Open tasks now — open tasks and how many of them are overdue.
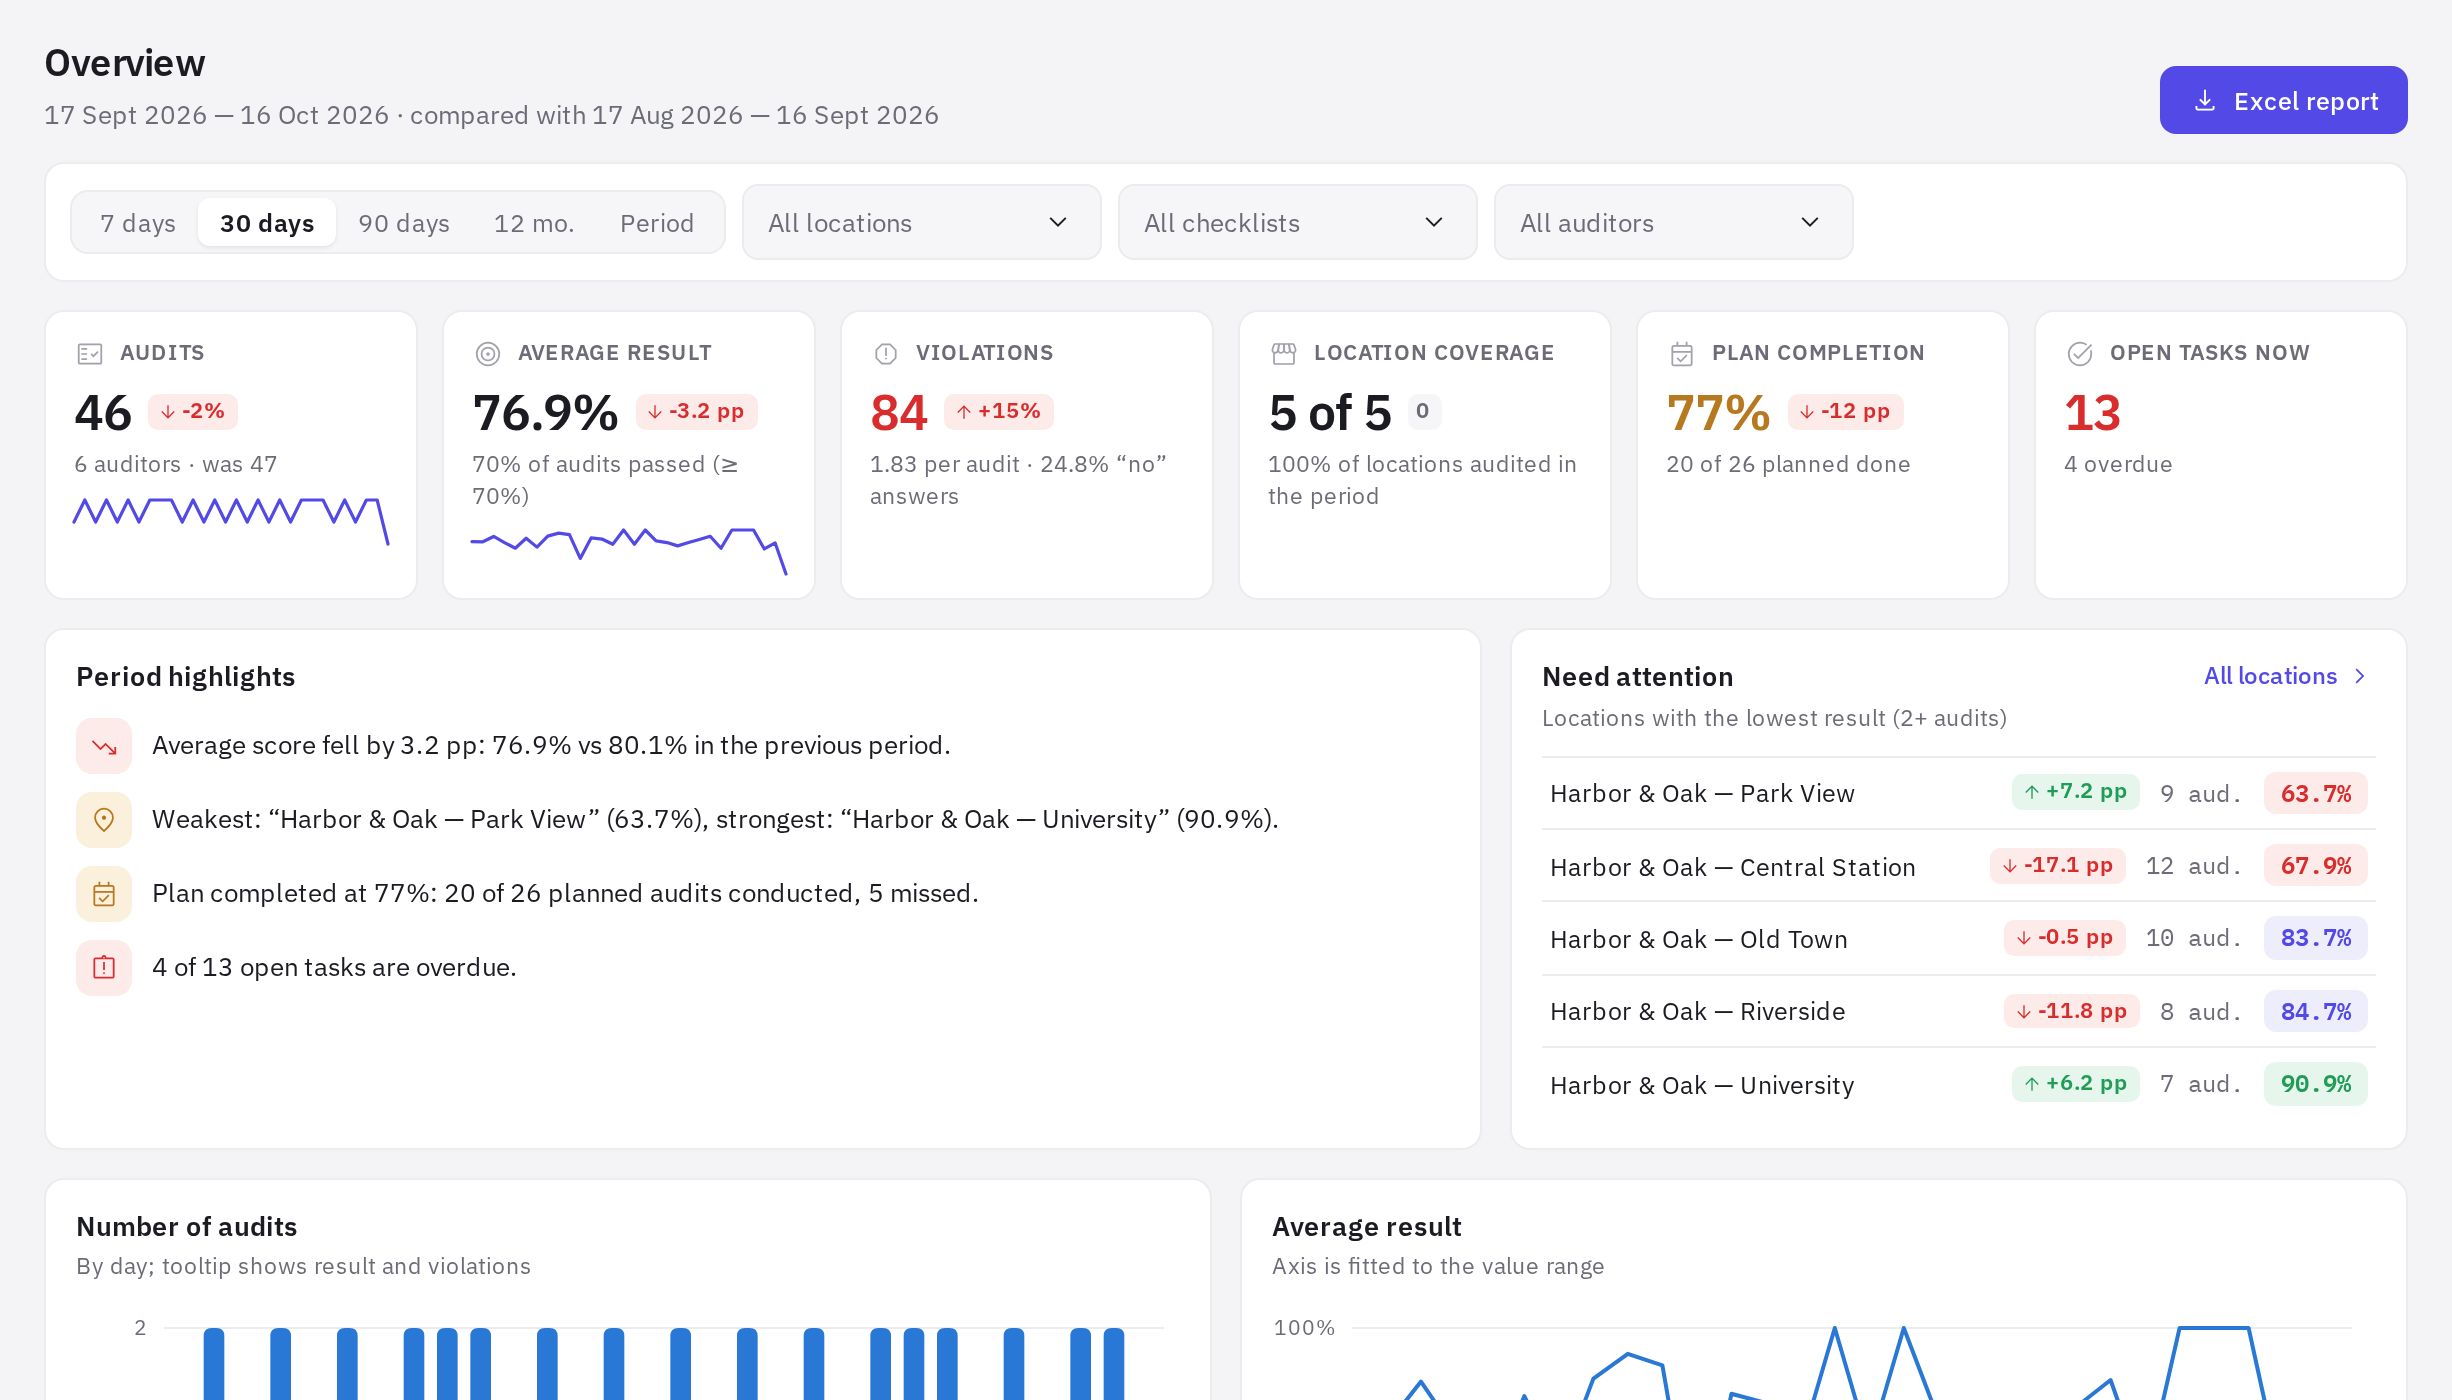
Below that: Period highlights (short written takeaways), Need attention (locations with the lowest results, with at least 2 audits), the Number of audits and Average result charts, Frequent violations, Result distribution by range, Which checklists are used, Top locations and Not audited in the period.
How to read the colors
Results are highlighted by threshold: 90% and above — green, 80% and above — blue, 70% and above — yellow, below 70% — red. A change versus the previous period is green if things got better and red if they got worse: for violations, an increase is bad.
Excel report
The Excel report button in the header of any section downloads a file with all analytics sections for the current filters — each section on its own sheet.
All analytics sections and exports are available on any plan, including the free Start plan. AI audit summaries are included in the Network and Enterprise plans.
Frequently asked questions
Why don't the numbers in Overview match the audit log?
The audit log has its own filters and period, which aren't linked to the analytics filters. Set the same dates, locations and checklists in both.
What is the “change vs. previous period” compared against?
Against a period of the same length immediately before the selected one. For “30 days”, that's the previous 30 days.
An audit was just submitted but isn't in analytics yet. Why?
Analytics data is updated with a delay of up to 5 minutes. Refresh the page a little later.
Thank you! This helps us improve the help center.