
Locations, checklists and auditors: how to read the metrics
These three analytics sections answer three questions: which locations are slipping, what exactly is being violated, and how consistent your auditors are. All of them follow the shared period, location, checklist and auditor filters — see Analytics: sections and filters.
Locations
Menu: Analytics → Locations.
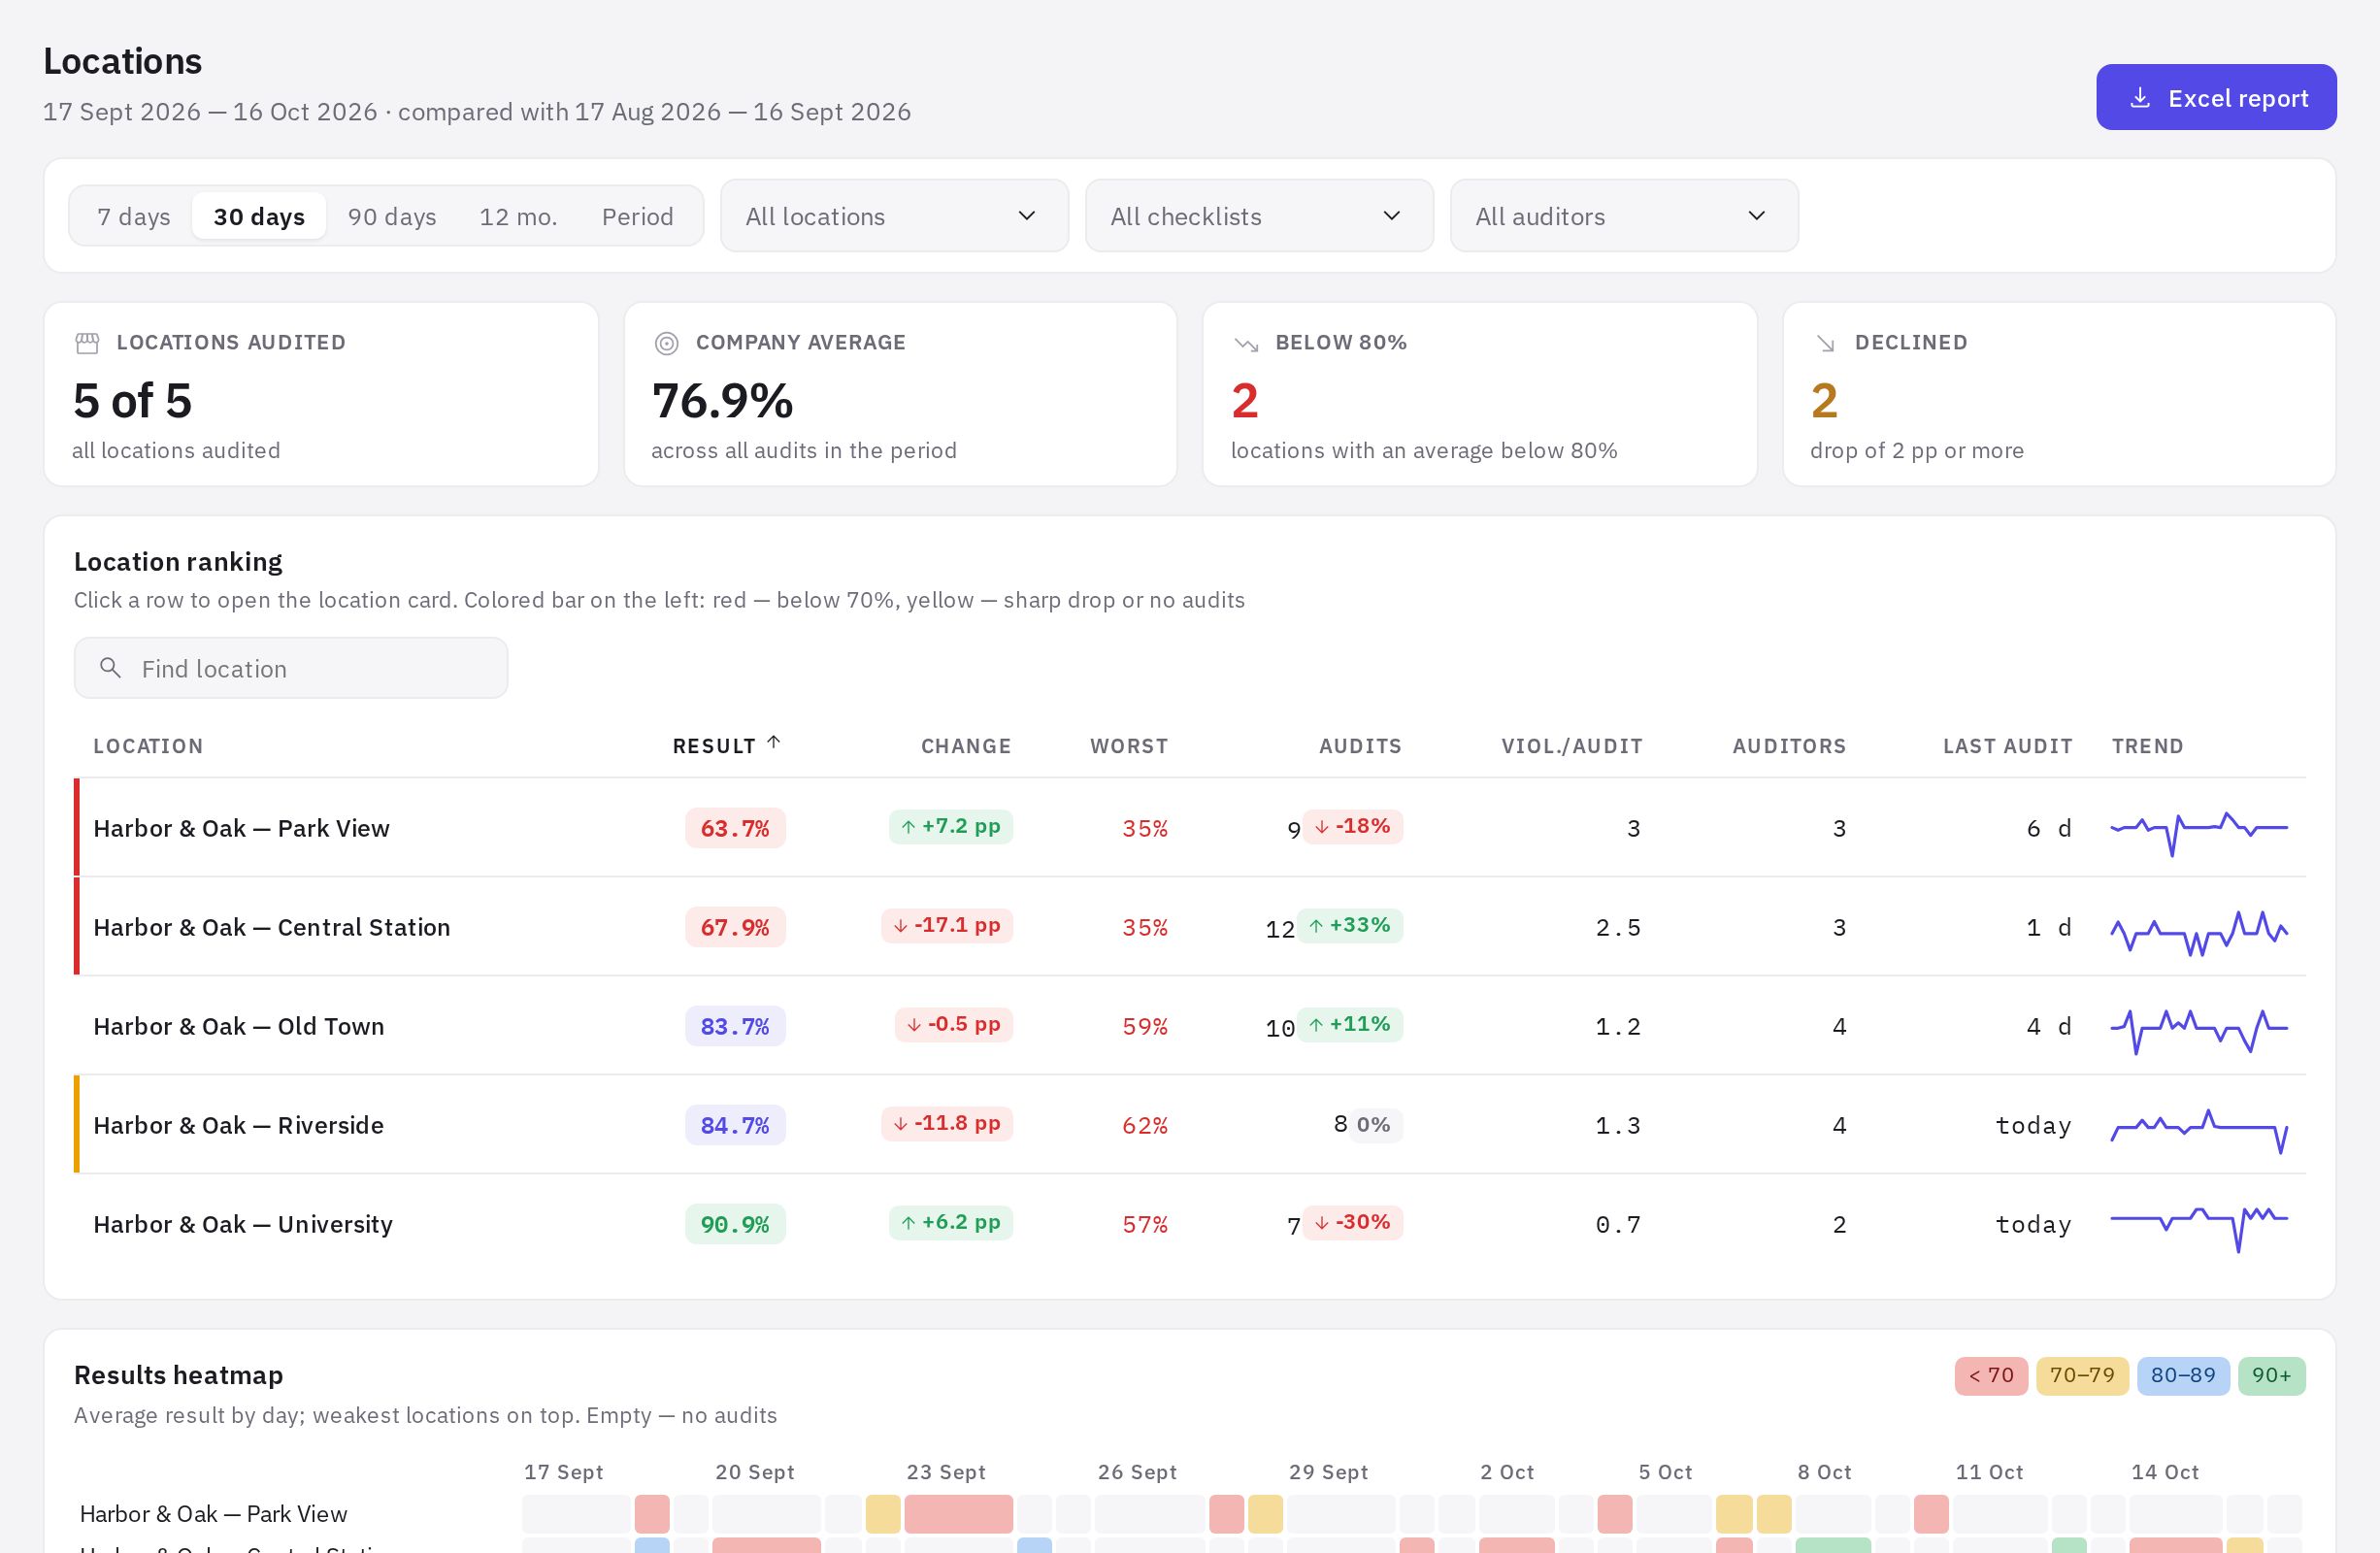
Cards at the top: Locations audited, Company average (across all audits in the period), Below 80% and Declined — locations whose average result dropped by 2 pp or more versus the previous period.
Location ranking is a table by location:
- Result — the average audit result for the period;
- Change — versus the previous period, in pp;
- Worst — the lowest result in the period;
- Audits, Viol./audit, Auditors;
- Last audit — how many days have passed since the most recent audit (all time);
- Trend — a mini chart.
The colored bar on the left of a row: red — result below 70%, yellow — a sharp drop or no audits.
The Results heatmap shows each location's average result by day, week or month; the weakest locations are at the top, and an empty cell means there were no audits. The No audits in the period block lists locations sorted by how long ago they were last audited.
Clicking a row or a location name opens its card: Result trend, results By checklist, Frequent violations and Recent audits with links to the reports.
Checklists and violations
Menu: Analytics → Checklists & violations.
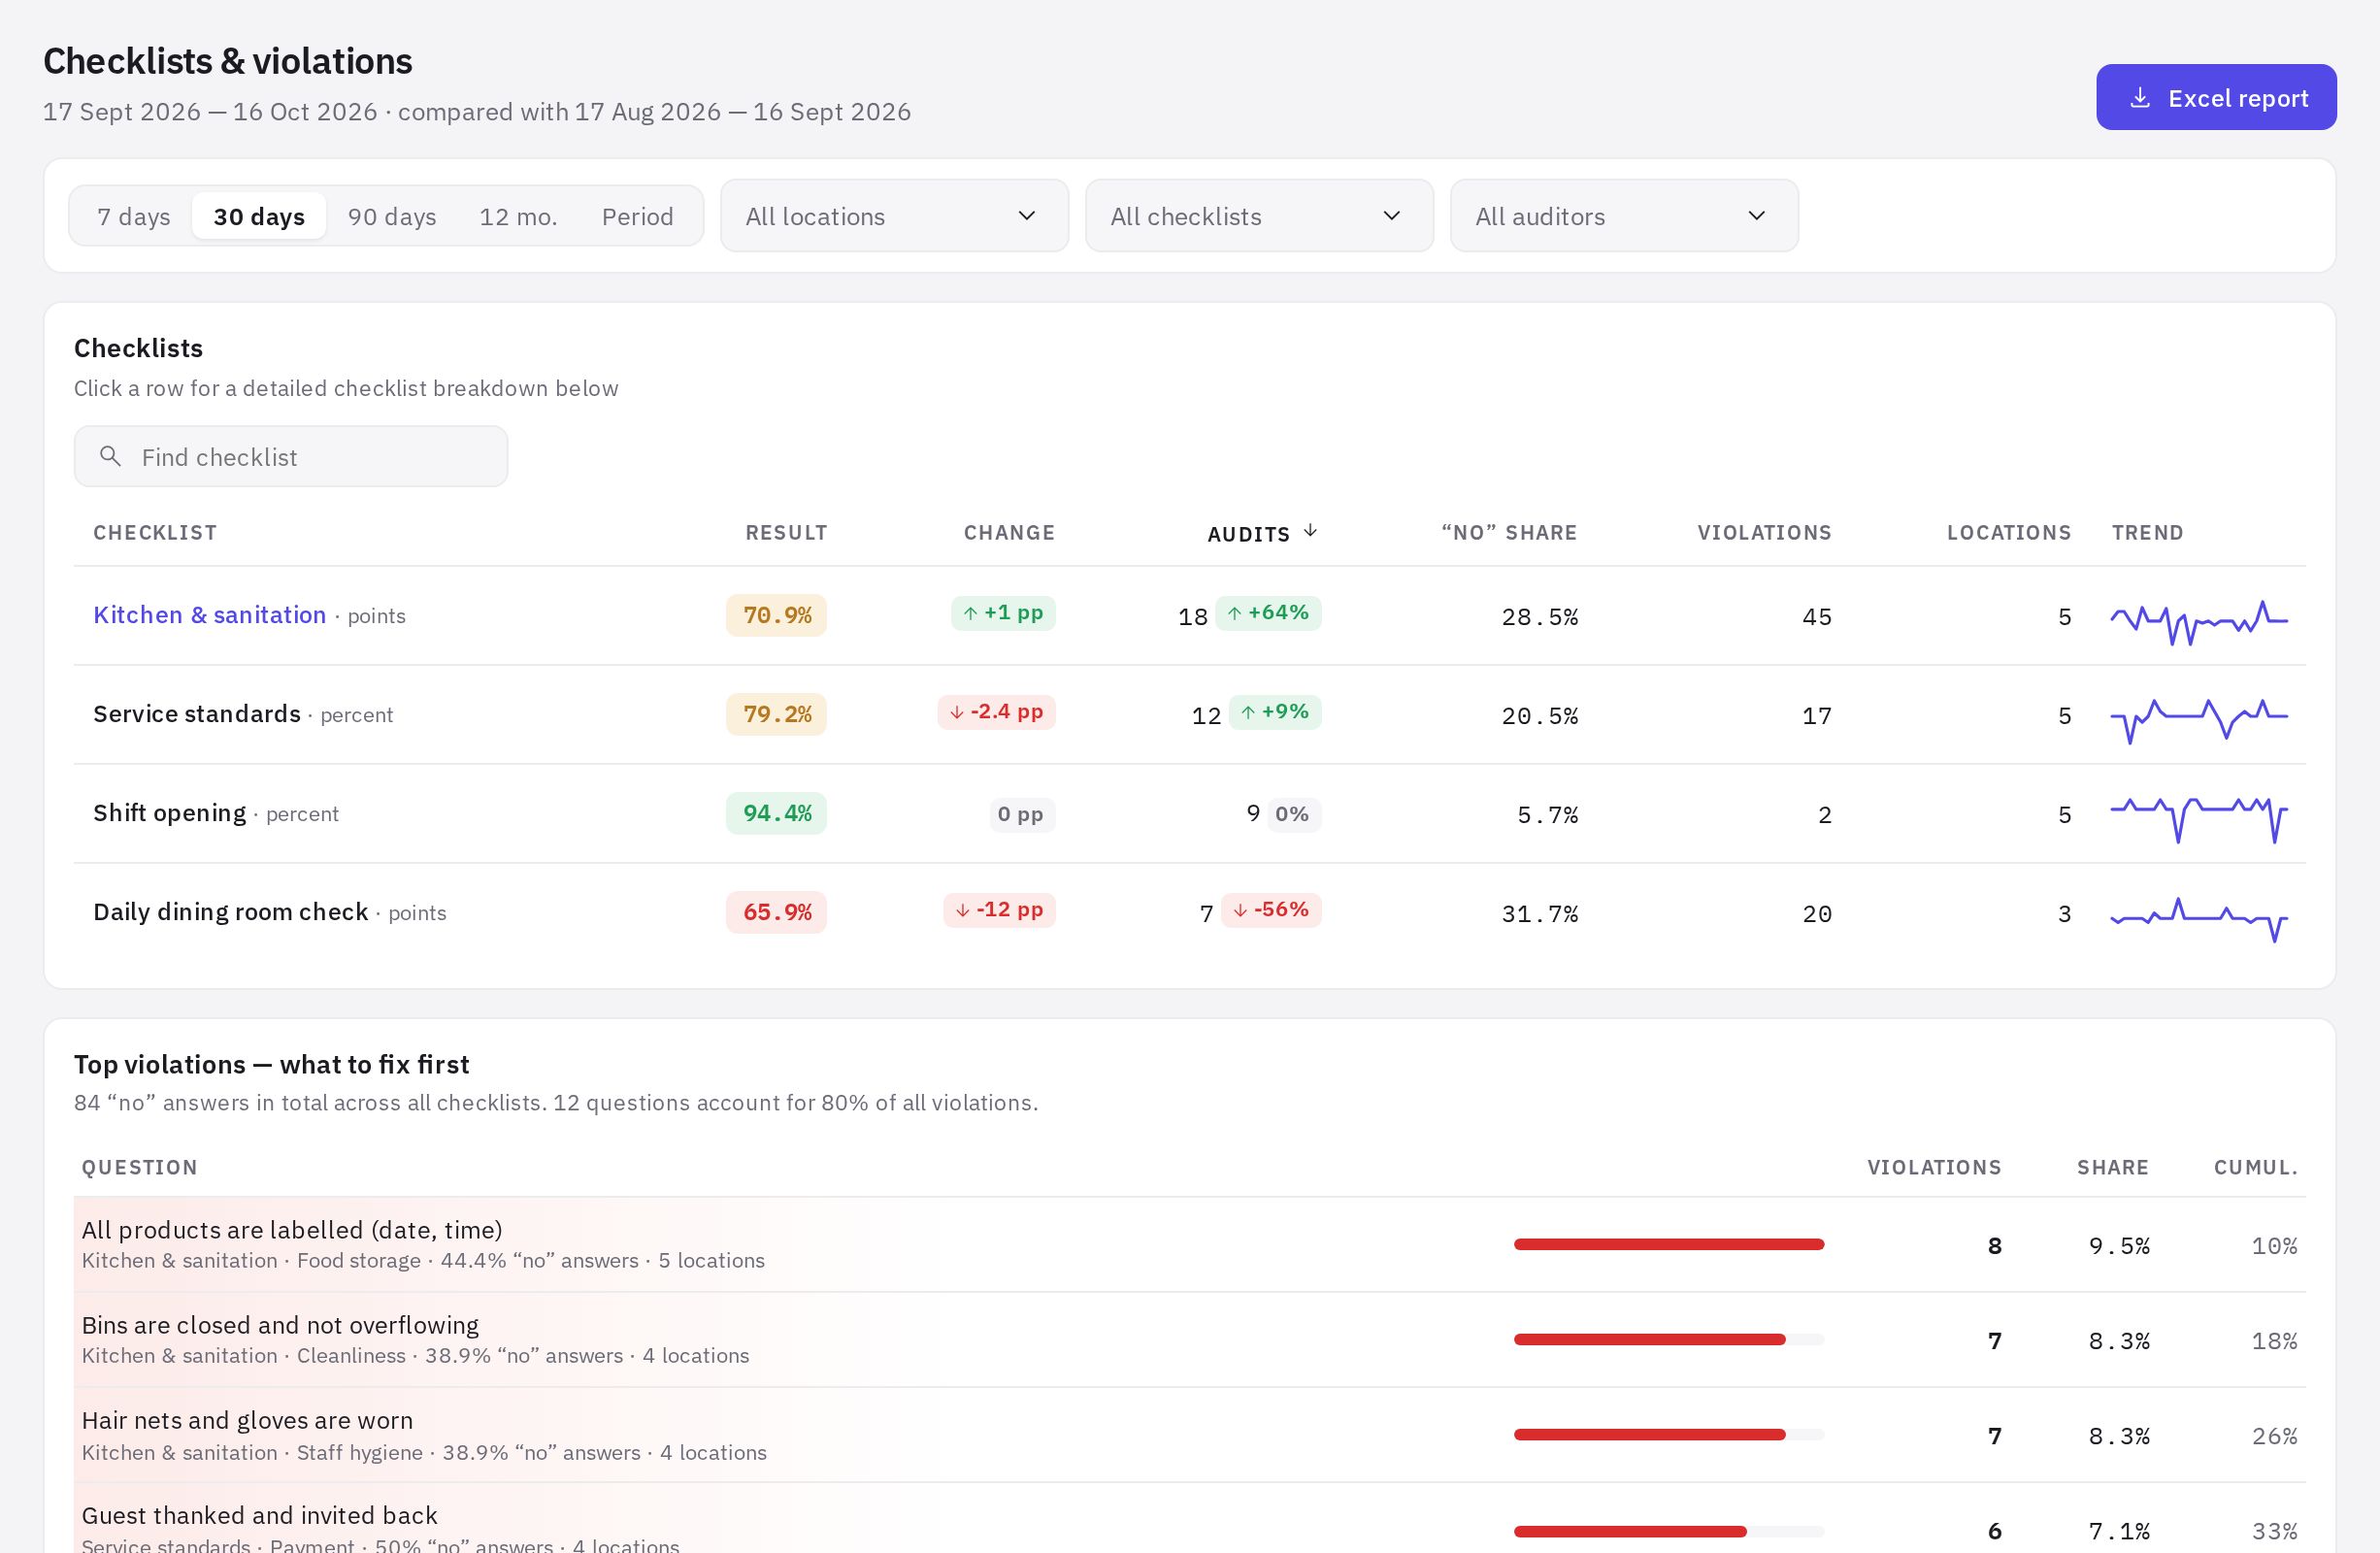
The Checklists table: Result, Change, Audits, “No” share (the share of “No” answers among all “Yes” and “No” answers), Violations, Locations, Trend.
The Top violations — what to fix first block lists the questions with the most “No” answers across all checklists. The Cumul. column is the cumulative share: it shows how few questions account for most of the violations.
Clicking a checklist opens a breakdown below:
- Repeat violations — the same question violated at the same location 2 or more times in the period. This is a sign that the problem isn't being fixed.
- Compliance by section — the share of “Yes” answers in each section.
- By location — location results for this checklist, weakest first.
- Checklist questions — for each question: “No” share, No, Yes, Skip, Locations with “no”, and the number of comments. A red bar means “No” in 20% of answers or more, yellow — 5% or more.
Start with repeat violations: a one-off mistake is a reason for a reminder, while a repeat at the same location is a reason to change the process or assign a task.
Auditors
Menu: Analytics → Auditors.
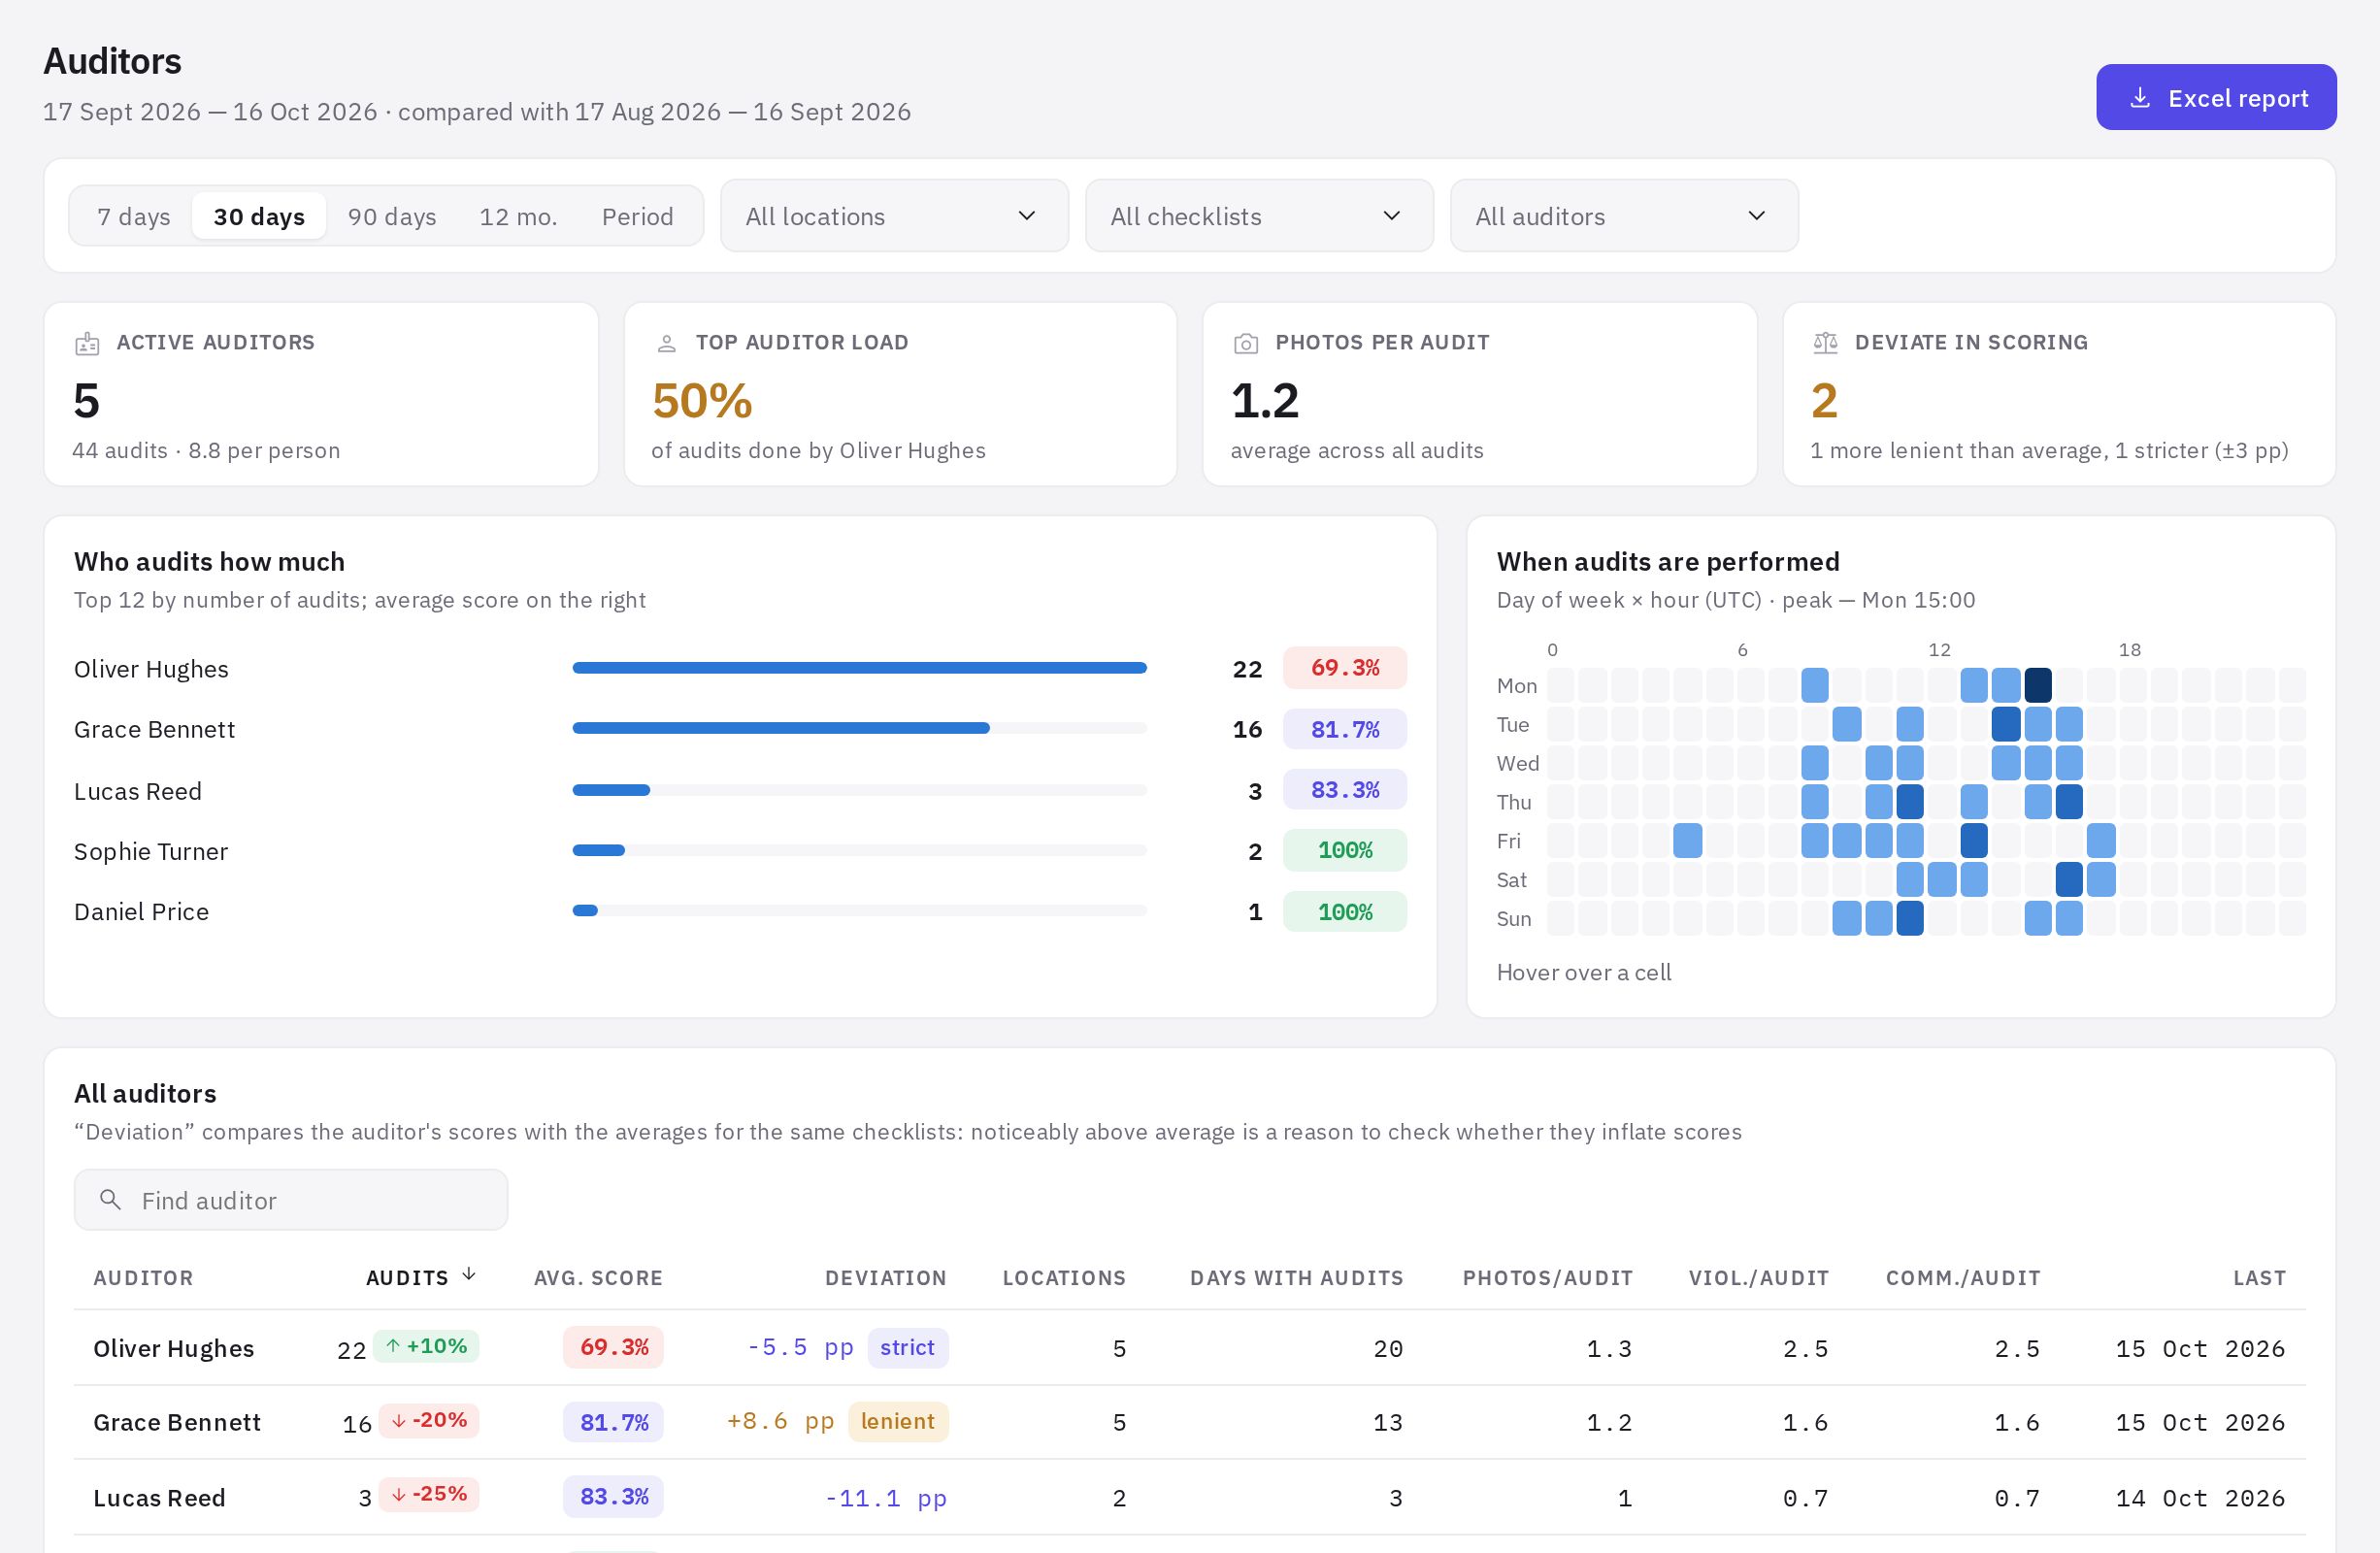
Cards: Active auditors, Top auditor load (the share of audits done by the most active auditor), Photos per audit (averaged across all audits) and Deviate in scoring.
Charts: Who audits how much — the top 12 by number of audits, with their average score, and When audits are performed — day of week × hour. Times on this chart are in UTC.
The auditor table: Audits, Avg. score, Deviation, Locations, Days with audits, Photos/audit, Viol./audit, Comm./audit, Last.
How to read “Deviation”
Deviation compares an auditor's scores with the average scores for the same checklists. A plus means the auditor scores above average, a minus — below. The lenient label appears at a deviation of +3 pp or more, and strict at −3 pp or less, provided the auditor has at least 5 audits in the period.
“Lenient” isn't proof of inflated scores: the auditor's locations may genuinely be performing better. It's a reason to compare their photos and comments with their colleagues' audits.
Frequently asked questions
Why isn't a location in the ranking?
It had no audits in the period, given the current filters. Such locations are listed in the No audits in the period block.
What's the difference between “Frequent violations” and “Repeat violations”?
Frequent violations count how many times a question was violated across all locations. Repeat violations are the same question violated at the same location 2 or more times.
Why does the activity peak on the chart show up at an odd time?
The “When audits are performed” chart shows times in UTC. Add your time zone's offset from UTC.
Thank you! This helps us improve the help center.