
Dashboards: your own summaries built from cards
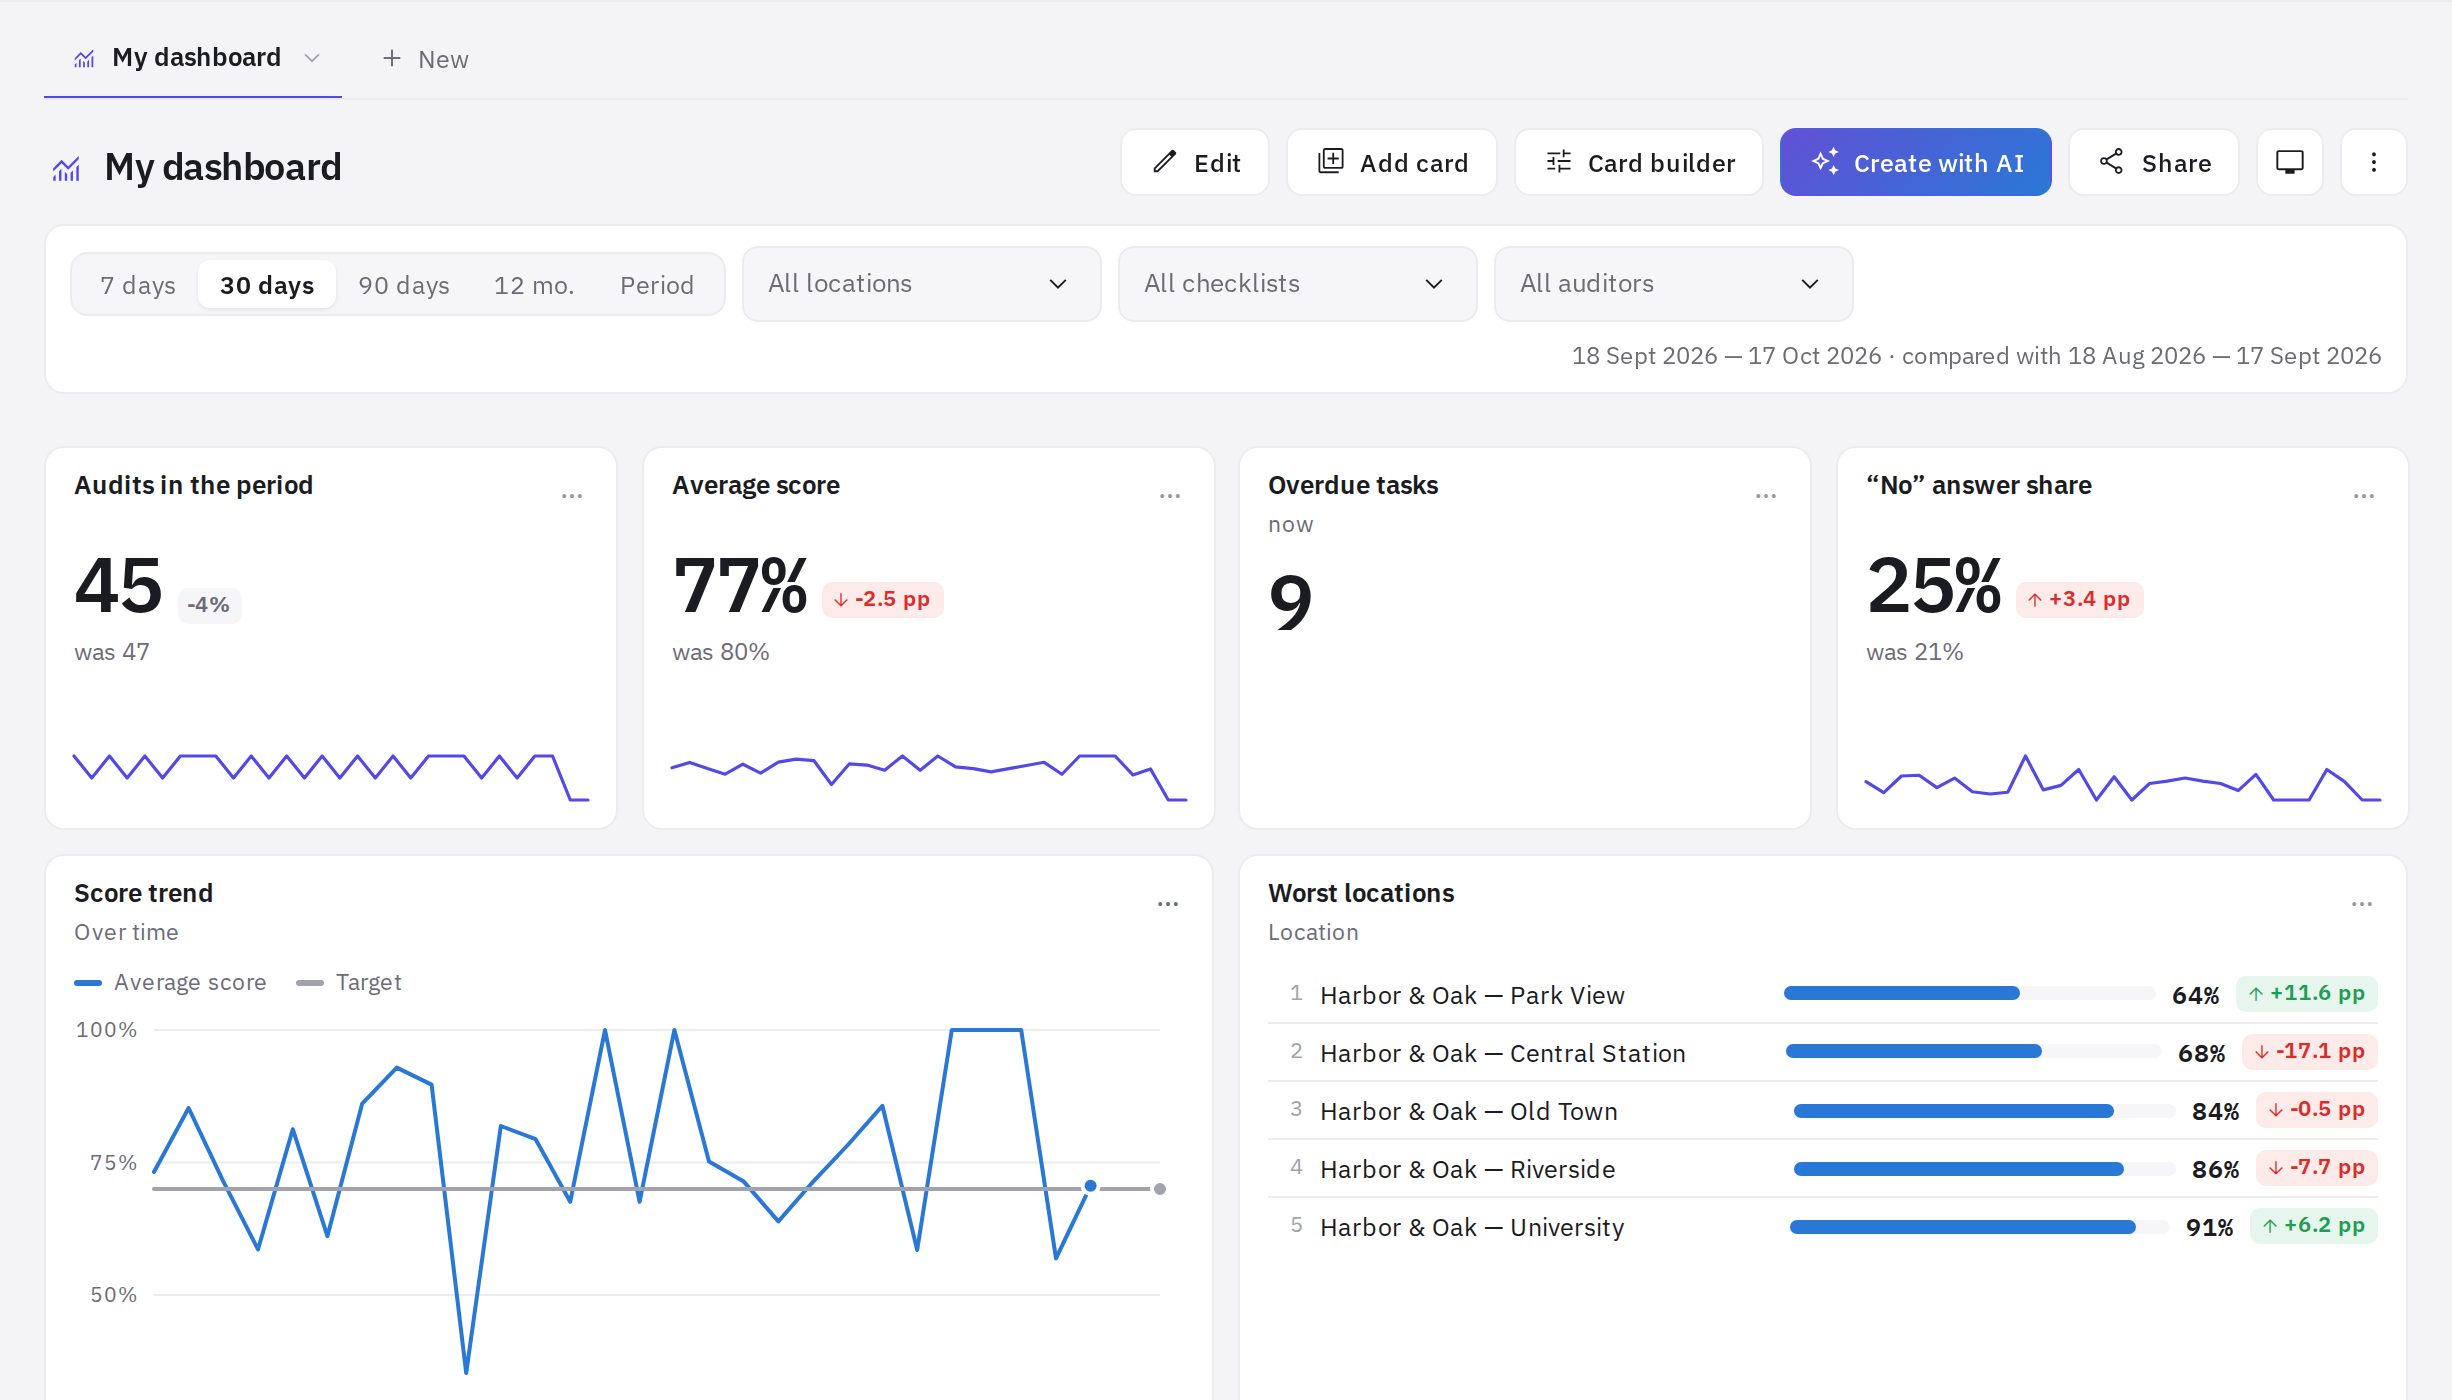
A dashboard is your own summary page made of cards: metrics, charts, rankings, tables and lists covering audits, violations, the plan, tasks, HACCP, tests, mystery shopping and instructions. You can drag cards around and resize them, and you can have several dashboards — each one opens in its own tab.
Where to find it
In the menu, go to Analytics → Dashboards. The first time you open it, jeCheck creates My dashboard for you from a ready-made template: “Network manager” for administrators and “Location manager” for everyone else. After that you can change it however you like.
Tabs: several dashboards
- Each dashboard is a separate tab above the page. + New creates another one: blank, from a template or from a description with AI (see Cards and AI in dashboards).
- Drag tabs to change their order.
- The tab menu has Rename, Access, Duplicate, Hide from tabs and Delete. Hidden dashboards are collected under the … more button (for example “2 more”), and from there you can Show in tabs again.
- Templates: “Network manager”, “Audit quality”, “Operations”, “Location manager”, “HACCP”, “Staff training”, “Mystery shopper”.
Filters: period, locations, checklists, auditors
Above the cards are the same filters as in analytics: 7 days, 30 days, 90 days, 12 mo. or Period (your own dates), plus All locations, All checklists and All auditors. Below the filters you'll see the period and the comparison period.
- The filters you pick apply only to you and only while you're viewing the dashboard.
- If you can edit the dashboard, Save for dashboard makes the current filters the default — the dashboard will open with them for everyone.
- As in dashboard brings back the default filters.
- A card can have its own period (for example “Month to date”) — then the period filter doesn't affect it. Metrics marked now (open and overdue tasks, assigned tests) show the current state; the period doesn't apply to them.
Edit mode: dragging and resizing
- Click “Edit”. Cards get a dashed border and a handle in the bottom-right corner.
- Drag a card by its header to a new place — the cards around it move out of the way.
- Drag the bottom-right corner to change the width and height.
- Click “Done”. The layout is saved automatically after every move; if you moved the wrong card, click Undo in the pop-up.
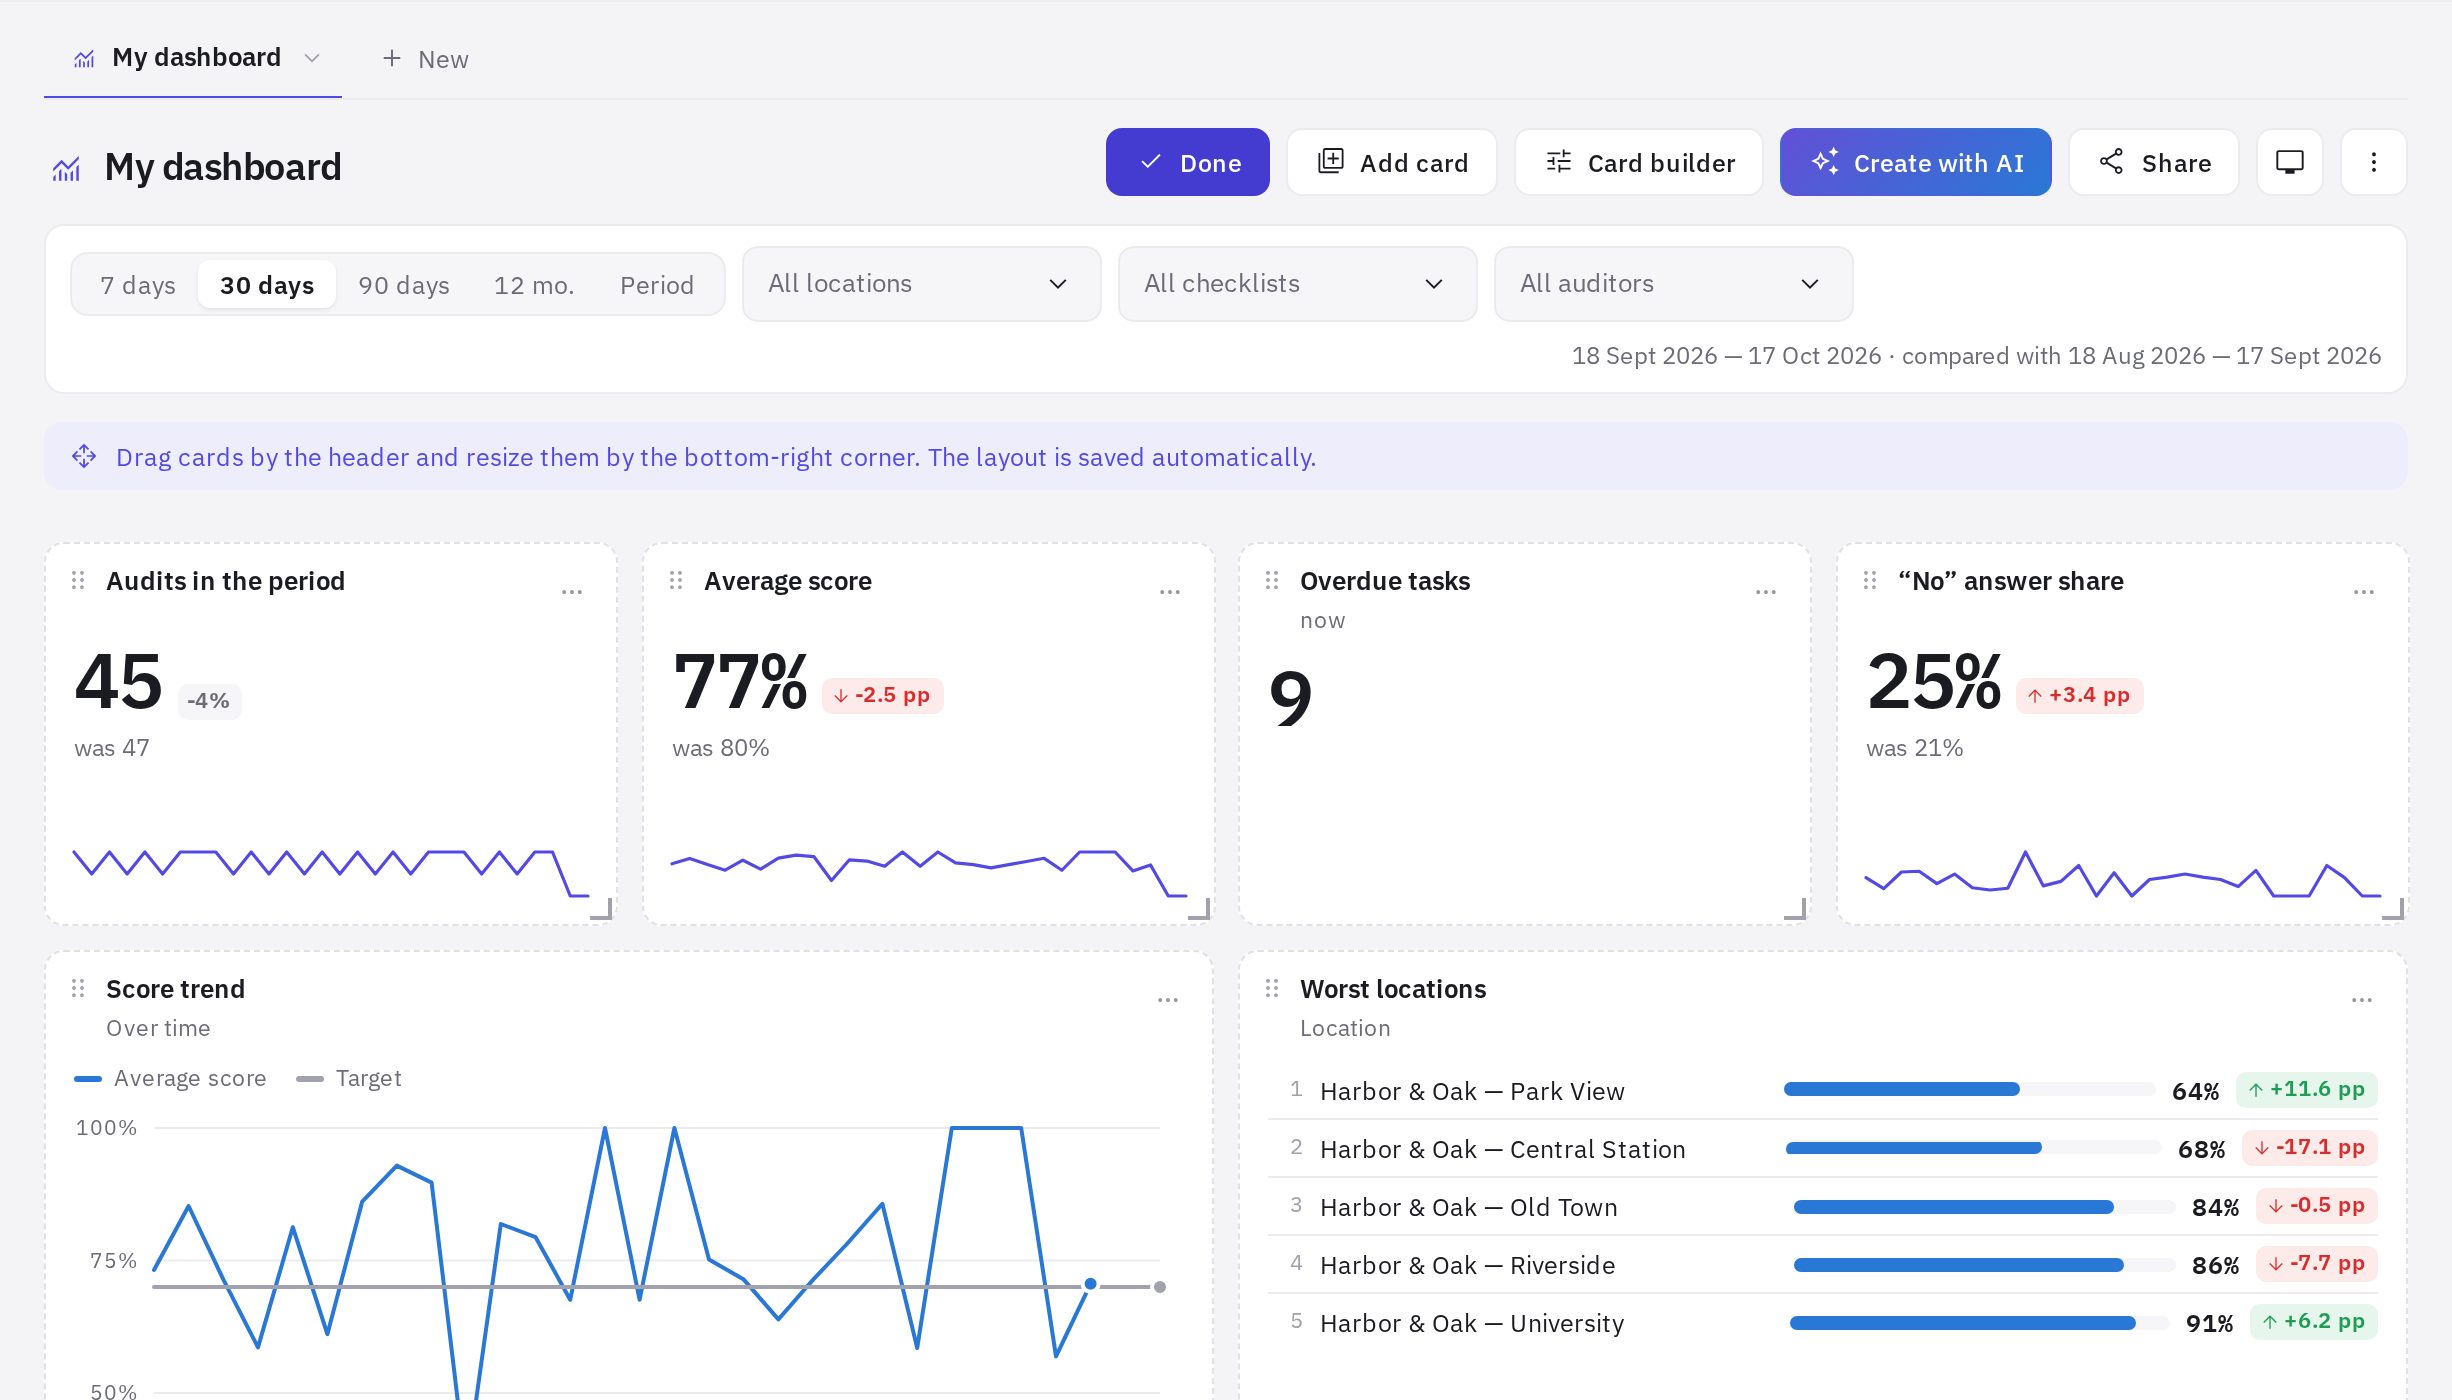
The grid has 12 columns. On a phone screen the cards are stacked one under another, and the layout can't be edited there — only viewed.
TV mode and auto-refresh
- The screen button (TV mode) shows the dashboard full screen — handy for a TV in the office or on the shop floor. The Cycle through dashboards checkbox switches between the visible tabs once a minute. To leave, click Exit or press Esc.
- In TV mode the data refreshes every 5 minutes. For normal viewing, turn on auto-refresh in ⋮ → Name, icon, auto-refresh: from Every minute to Every hour.
- ⋮ → Refresh data recalculates the cards immediately. Card data is cached for 5 minutes.
Who sees which data
A card is a setting for “what to show”, not a set of fixed numbers. The data is calculated afresh for everyone who opens the dashboard, with their own permissions:
- administrators see all locations; everyone else sees only the locations they're assigned to (just like in analytics);
- HACCP cards show the locations the person has access to in HACCP;
- testing cards are visible to administrators and test editors, mystery shopper cards to administrators; for anyone else such a card shows “No access to data in this section”;
- if a section isn't included in your company's plan, the card shows which plan it's available on.
That's why it's safe to open a shared dashboard to the whole company: a location manager will see their own location on it, and the director will see the whole network. More in Dashboard access.
Frequently asked questions
How are dashboards different from the Overview section?
Overview and the other analytics sections are ready-made pages with a fixed set of blocks. You build a dashboard yourself: you choose the metrics, the chart types, the order and size of the cards, and you can keep several dashboards for different purposes.
How many cards can I add?
Up to 60 cards on one dashboard.
Will my filters change for my colleagues?
No. Only you see the filters you've selected. They change for everyone only if an editor clicks Save for dashboard.
Thank you! This helps us improve the help center.